
As you know, I regularly publish stock analyses on other platforms. The good thing about the TEV blog is that I can try out new formats here. Therefore I would like to present a “Fundamental Stock Pick” at regular intervals in the future and create a short analysis of one stock for my readers. The purpose of this format is to give readers a quick overview of the company’s fundamental figures. The fundamental stock pick this week is General Mills.
If you want such a “Fundamental Quick Stock Price” analysis of a specific company, just write in the comments which company you want me to analyze.
The company
Let us first take a look at the company and its business model.
General Mills is one of the largest food producers in the world and, therefore, one of the non-cyclical stocks. Non-cyclical stocks are particularly suitable for risk-averse investors. Such companies usually have a stable business and a secure market position.
General Mills offers a broad product portfolio which includes breakfast cereals, ready meals, pet food, yogurt, pizza, pasta, and much more. The company’s most famous brands include Big G cereals, Häagen Dazs, Pillsbury, Green Giant, Old El Paso, Betty Crocker, and Blue Buffalo.

Business development
At this point, we take a look at the development of the business in recent years.
How has the company developed in terms of business? Has it grown or shrunk? Does it generate stable cash flow? In this paragraph, we look at the operational growth of the company. Although past growth is no guarantee that a company will continue to grow in the future, it does give a good picture of the general condition and health of a company. This picture allows a better evaluation of the following test parameters because we have to evaluate young and fastly growing companies differently than established blue chips that already have an established market position and therefore do not grow that strong.
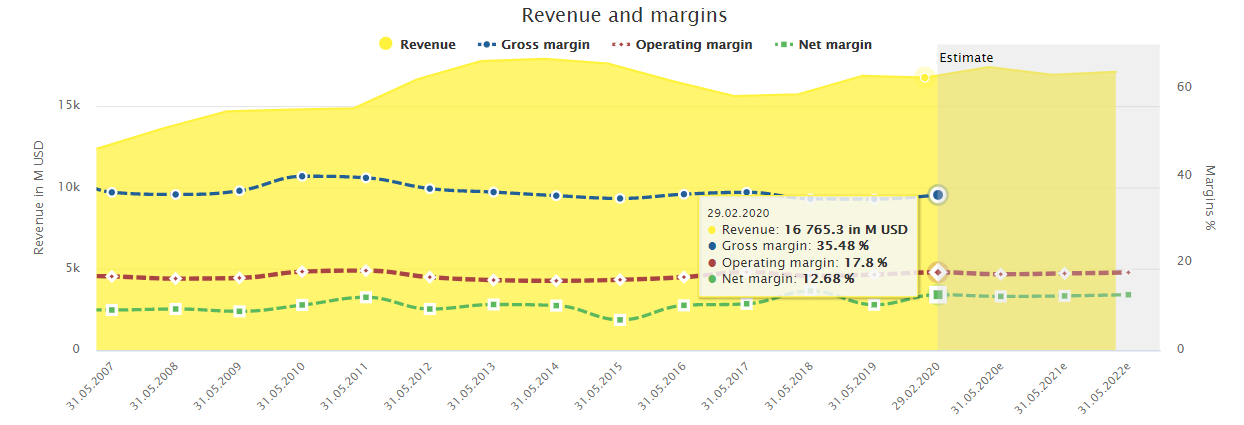
In 2019, General Mills generated revenues of nearly $17 billion and a free cash flow of $2.5 billion. While the cash flow has increased continuously over the last ten years, the company has been struggling with revenue problems since 2015. Recently, however, things have been moving in that direction again, of course, also due to the takeover of Blue Buffalo.

Profitability
Companies should not only grow but also be profitable. Profitability ultimately indicates how much of the turnover remains when all other costs such as taxes, depreciation, etc. are deducted. The difference between revenue and profit is the margin. Companies should have the highest possible margin (i.e., as much profit as possible should remain from revenue).
Investors in General Mills currently have less to worry about in terms of profitability, as there have been no particularities that give cause for concern in recent years. Although the company did not manage to increase profitability significantly, margins did not fall either.
Value
Warren Buffett once said: “Price is what you pay; value is what you get”. The idea is quite simple but relatively difficult to realize. Investors like Warren Buffett consider whether the price of a share is lower (or higher) than its value. Imagine a car that someone sells for a price x. Imagine that the motor alone is worth more than the selling price. The intrinsic value is, therefore, higher than the amount paid. So if you buy the car at this price and the radio or some tires break down, it doesn’t matter, because you got all these things almost “for free”. That gives you a fair amount of protection, doesn’t it? That’s what investors, such as Warren Buffett, call a margin of safety. Quite an easy thing, right?
However, putting this theory into practice is not always easy. There are many different methods to find out such a margin of safety. So let’s see if we can determine such a “Margin of Safety” for today’s “Fundamental Stock Pick Of The Week”.
Price/Earnings ratio
The Price/Earnings ratio (P/E ratio) tells investors the ratio of a company’s share price to the company’s earnings per share. This figure shows you how many years you will have to wait until you have recovered your purchase price per share with the earnings per share. So if a company has a P/E ratio of 10, it would take ten years for your profits to be as high as the price you paid for your investment. One can also say that it would take ten years before the company could buy itself with the profit. Accordingly, one can first make a general statement: The lower the P/E ratio, the cheaper the stock appears.
However, you should know some potential pitfalls here. This calculation assumes stable earnings for the future. However, profits may drop in the future. Likewise, earnings can be “whitewashed” through accounting measures. It is, therefore, essential to conduct a thorough analysis and not just rely on the current P/E ratio!
Regarding General Mills, we see that the company is trading below its 5-year median P/E ratio.

That’s a good sign. But we also noticed that the company was struggling with some revenue problems (see above). Revenue problems naturally justify a discount on the P/E ratio. However, you can also see that the market has traded General Mills at a much higher valuation.
General Mills pays above-average dividends
Dividends can indicate a company’s intrinsic value. Dividends are payments made by a company to its shareholders. Every shareholder who holds shares in the company on the ex-dividend date is entitled to receive dividends (click here for TEV’s dividend calendar). The dividend yield is the ratio of the dividend payment per share to the share price. If a share costs $100, and the company pays $2 in dividends per share, the dividend yield is 2 percent.
But you must also be careful when considering dividend yields in isolation. An unusually high dividend yield (especially anything above 7 or 8 percent) is a big red warning sign. The market gives you no presents, and with a high chance always comes high risk. Maybe, the cash flow or the profit does not cover future payouts, so that the company has to reduce or even cancel the payouts. Therefore, we have to consider other variables, such as the payout ratio.
The payout ratio shows you what percentage of profit the company would have to spend to finance the dividend payout. Anything over 100 percent is, of course, not good, because the company then cannot save for bad times or finance further growth. In such constellations, investors must be particularly careful.
General Mills pays dividends. The dividend scoreboard looks as follows:
Dividend Yield: 3.13Percent
Payout Ratio: 55.27
Dividend Growth: 0 Years.

After the expensive Blue Buffalo takeover, General Mills has decided not to increase the dividend to be able to reduce debt more quickly. With a dividend yield of over 3 percent, however, the company is above average.
The payout ratios have recently fallen again somewhat, which is a good sign. A lower payout ratio leaves more money to invest in growth or even to increase the dividend. Unfortunately, the dividend yield has fallen somewhat due to the share price increases. However, it is still in the upper third if you look at the last 10 years.
Furthermore, the payout ratio shows us that General Mills’ dividend is not in question.
Price/Book Value ratio
The Price/Book Value ratio compares a company’s current market price to its book value. A value of 1 means that the price of a share corresponds precisely to the (proportionate) book value of the company. Accordingly, a ratio below 1 is a good sign for value investors. However, such gems are rather rare to find, and if so, it is worth taking a closer look as well. For example, companies that operate in a challenging market with poor prospects (e.g., tobacco or oil) can have a particularly low price/book value.
Concerning General Mills, the price/book ratio indicates a historically fair valuation. Although General Mills is trading significantly below the 5-year median, this is probably only a lag effect due to the high valuation around 2015.

Price/Cash Flow ratio
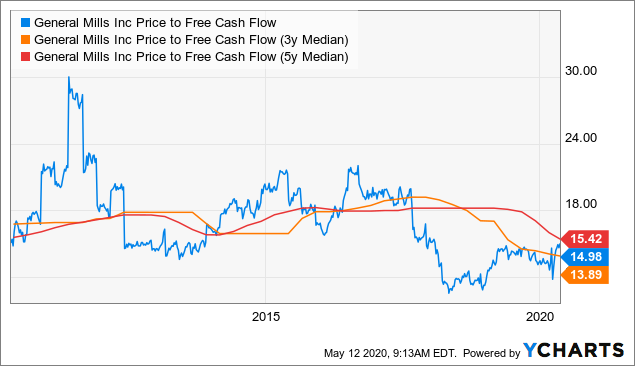
The Price/Cash Flow ratio compares a company’s current market price to its cash flow. With this metric, you can check how many years it would take a company to buy itself with its yearly cash flow.
The price/cash flow ratio also indicates a fair valuation for General Mills from a historical perspective.
Balance Sheet
The balance sheet says a lot about the financial health of a company. Is it heavily indebted, or is the company liquid enough to pay its debts?
General Mills is indeed in debt. Total debt (here including total liabilities) has risen dramatically due to the acquisition of Blue Buffalo.

However, investors can see that General Mills has been able to reduce its debt extremely in recent years. To this extent, the debt ratio has also fallen to below 60 percent. That’s still high, but you can see that the company is moving in the right direction.
What are General Mills’ competitors?
Of course, you should never look at a company in isolation, no matter how much you go into detail. In the second step at the latest, you must compare the company with its competitors (peer group). General Mills’ competitors are in particular:
– Nestle
– Unilever
– Danone
General Mills Fundamental Stock Analysis
TEV’s rating system
After every analysis of a company, I will use a three-grade rating. Its purpose is to ensure that readers recognize at first glance whether a company might or might not be worth investing in. The three steps rating at a glance.
Buy the jewel now rather than tomorrow if:
- There are no downsides, and the company has growth potential.*
- The upsides outweigh the downsides, and the company has enormous growth potential.
Worth an investment (maybe later after a second look) if:
- The upsides outweigh the downsides.
- The upsides are equal to downsides, but the company has growth potential.
No thanks if:
- No growth potential in the long term.
- The downsides outweigh the upsides.
*Of course, the growth potential is a part of the upsides, but it is also crucial in my final considerations.
Conclusion: The grade for General Mills
All in all, we can say the following about our Stock Pick today: General Mills is a consumer goods company that has finally gotten back on track. However, it is no longer a bargain but much more fairly valued. My personal opinion is that the company still has some potential for further growth. The important thing is that it continues to pay back debt quickly and then starts to increase dividends again. The company is definitely worth an investment, but there is no rush.
If you are looking for other stock investment in less cyclical companies, I definitely suggest the following defensive companies:

Did you like the article “General Mills Fundamental Stock Analysis”? Stay tuned for the following content… It is all entirely for free! Enjoy!
If you don’t want to miss any new articles, you can easily follow me on
or Twitter.
Sharing Is Caring
Your thoughts are too valuable to keep them to yourself. Make them available to the world and the community by sharing them with us. All you have to do is leave a comment after reading the posts on the blog. Just use clear writing and clear thoughts.


Hi TEV, manay thanks! Can you do an analysis on Ford or GM?
Hi Vic, sounds good to me! I think this might interest some readers.
Thanks for commenting!
What about airlines?
Hi Robert, yes airlines are definitely worth a look! Thanks for commenting!