
I welcome you to a new episode of my Dividend Diary on the TEV Blog. Is there anything better in the financial world than a dividend income? Well, I guess not. And so, in November, I was again pleased to see a substantial increase in my dividends. I also used this month to add more shares and stocks to my portfolio. As always, in my monthly reports, I will give an update on my purchases. I document my monthly dividend income and the changes in my broadly diversified retirement portfolio. Here, I show you which companies have generated juicy cash flow for me each month and which stocks went into my basket. Besides, I analyze how the month has performed compared to the previous year. In the best case, my dividend income has increased.
As you know, I take care of my wealth management. To keep things simple, I have built three pillars:
- Active income.
- Passive income.
- Conversion.
Dividends fall into the last two categories. They are passive because I no longer have to work to receive the payments. Furthermore, they also contribute to the conversion because I reinvest the dividends and thus increase my passive income through dividends for the future.
My monthly dividend income in November:
This month I have received payments from the following companies:
- AT&T (14.78 EUR)
- General Mills (10.95 EUR)
- CVS Health (5.68 EUR)
- Stroeer (33.86 EUR)
- Apple (7.21 EUR)
- General Dynamics (5.53 EUR)
- Realty Income (3.08 EUR)
- Kinder Morgan (11.08 EUR)
- AbbVie (12.63 EUR)
- Procter & Gamble (10.96 EUR)
- Omega Healthcare (9.28 EUR)
- Unilever (9.16 EUR)
- Caterpillar (4.50 EUR)
- Amundi MSCI E.M. ETF (25.40 EUR).
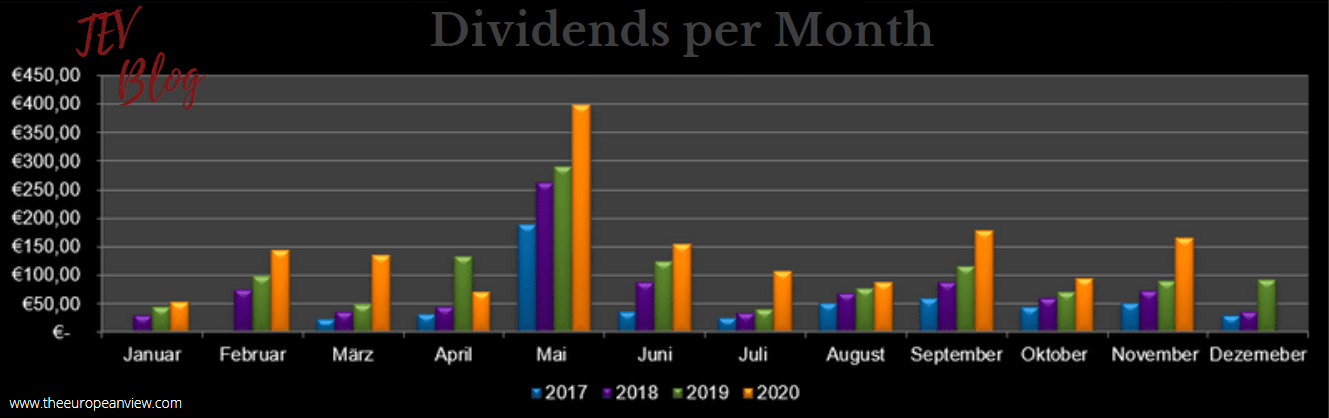
The total dividend income in November was: EUR 164.10/appr. USD 196.40
Dividend income check
Now let’s see how the performance was compared to the previous year. Last year, I received only EUR 90,03 in dividends in November, which represents an increase of almost 83 percent.
Overall, I have received almost EUR 1,600 this year. That is far above the total dividend income of last year, which was slightly more than EUR 1,200. Let’s hope that this development continues in the remaining month of the year. The overall development of my dividend income is as follows:
Stock purchases in November for more dividend income
In November, I bought more shares of great companies so that the dividends will continue to rise in the future:
- Novo Nordisk (9 shares)
- Amundi Index MSCI Emerging Markets UCITS ETF DR (D) (10 shares)
- Teamviewer (17 shares)
- Vonovia (10 shares)
- Fresenius (10 shares)
In the following, I will briefly explain why I bought these companies. Please do not expect a fundamental analysis. I will only mention some aspects per company that might be of interest to the readers. Maybe you will find inspiration for your investment. In case you disagree, feel free to write your opinion about my purchases in the comments.
In November, I wanted to focus on diversification
For me, November was all about diversification. Currently, I have the problem that many stocks are fundamentally too expensive. I still have a few stocks on the watchlist, such as Merck & Companies or Intel, but these would again be US American stocks.
Therefore, at the beginning of November, I decided to diversify my portfolio geographically and not buy Anglo-American stocks. I did that and bought even more shares from four companies and increased shares in one ETF (see above).
I have bought mostly European stocks (three times Germany, once Denmark). The Amundi ETF, in turn, tracks the emerging markets. The additional purchase was even included in the dividend payment at the end of November. I didn’t know precisely when the ETF’s ex-dividend date was, but it must be pretty close to the payout date.
Many of you have written to me and said that you would like to have a closer look at European stocks. I recently wrote about some European stocks in an article about family-owned companies. Today, I want to use my “Dividend Diary” to write about an attractive European champion. The company is Fresenius SE. It is one of the oldest European dividend aristocrats and is currently historically undervalued, mainly because the share price has fallen steadily in recent years. Therefore I want to take the opportunity for a closer look at the stock.
The Group structure
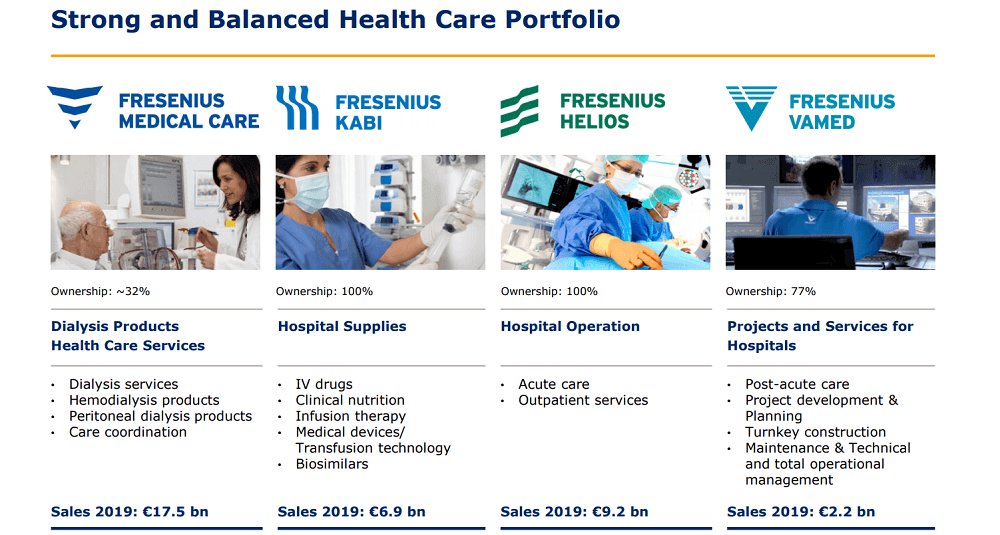
Fresenius is a global health care company with products and services for dialysis, hospital, and ambulatory/home care. The Group has four independently operating divisions. All segments are market leaders in growth areas of the healthcare sector.
- Fresenius Medical Care: Fresenius SE currently holds 31 percent of Fresenius Medical Care shares and is thus the largest shareholder. Fresenius Medical Care provides kidney dialysis services through a network of 3,994 outpatient dialysis centers, serving 345,096 patients. It is listed on the stock exchange.
- Fresenius Helios: Fresenius Helios is Europe’s largest private hospital operator. Fresenius Helios owns and operates HELIOS hospitals in Germany (111 of its own clinics and 24 rehabilitation clinics) and Quirónsalud hospitals in Spain. Quirónsalud is the leading private hospital operator in Spain, which operates 43 hospitals, 39 outpatient healthcare centers, and some 300 institutions for corporate health care in all of Spain’s metropolitan areas.
- Fresenius Kabi: Fresenius Kabi offers essential drugs, medical products, and services for critically and chronically ill patients. It provides products (such as technologies for infusion, transfusion, and clinical nutrition), services for dialysis, in hospitals, and inpatient and outpatient medical care.
- Fresenius Vamed: Fresenius Vamed is specialized in the project and management business of health care facilities. The portfolio includes project development, planning, construction, maintenance, technical management, and overall operational management of health care facilities. Fresenius SE currently holds 77 percent of Fresenius Vamed’s shares.
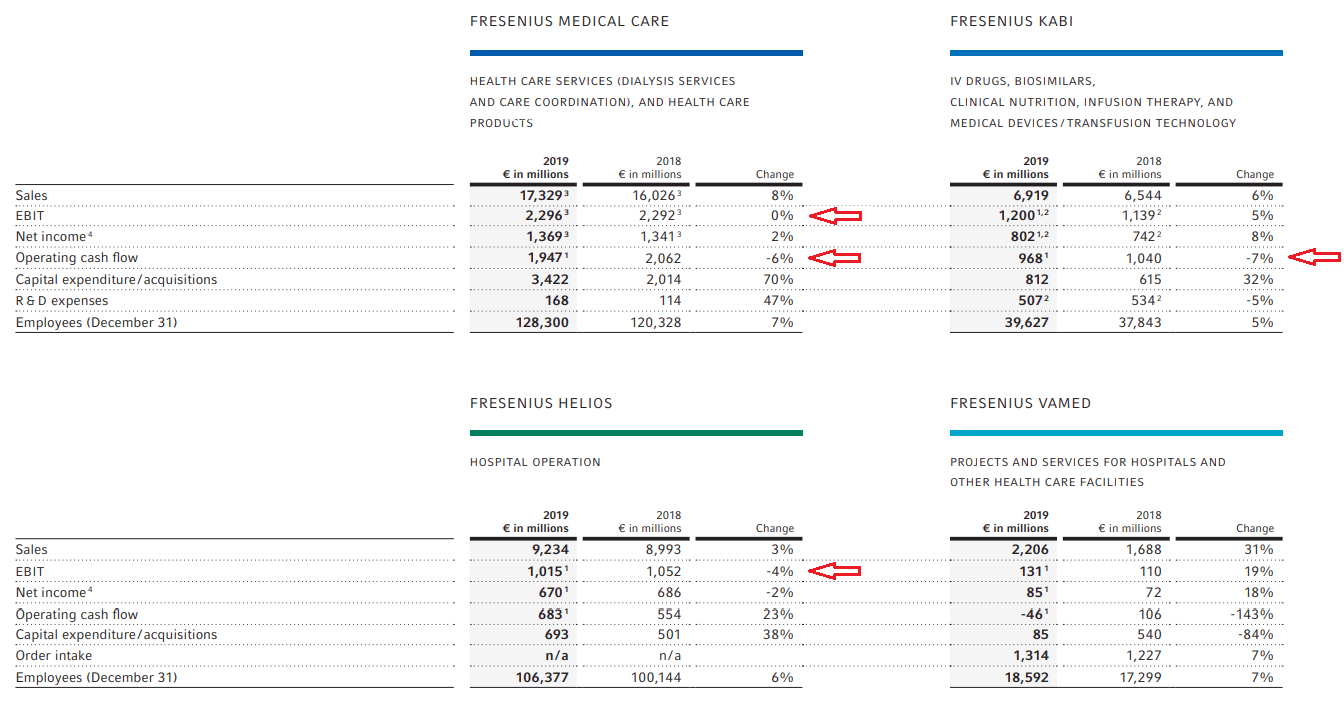
Overview of the company
Below you will find once again an overview of the company. As you can see, Helios and Medical Care generate the most revenue, although Fresenius SE has only a minority interest of 33 percent in Fresenius Medical Care.
Revenue by region
Fresenius SE generates its revenue in the following areas:
- North America (43 percent of total revenues)
- Europe (43 percent of total revenues)
- Asia-Pacific (9 percent of total revenues)
- Latin America (4 percent of total revenues)
- Africa (1 percent of total revenues).
Fresenius SE’s share price has recently fallen sharply. In EUR, the company is almost 50 percent away from its 2017 high. You can see the reasons for this in the following. Even if Fresenius can still increase revenues, it has problems with profitability. For example, earnings per share fell from EUR 3.63 in 2018 to EUR 3.38 in 2019, even before Corona. The Corona crisis will intensify this development (because, for example, many operations had to be canceled or postponed). The operating and net margins will also fall below 5 percent.
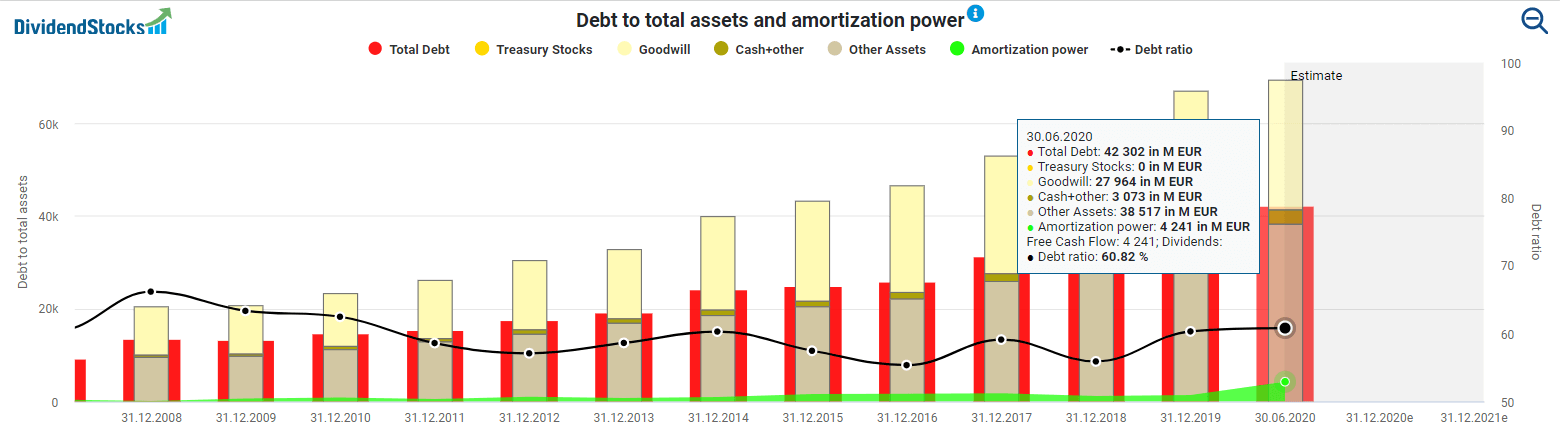
The revenue growth of the last years was mainly due to the acquisitions of other companies. The numerous takeovers have resulted in high debts. The mountain of debt (including all liabilities) now amounts to EUR 42 billion. The debt ratio is 60 percent. In my opinion, this is on the edge of what I still consider reasonable. On the other hand, Fresenius has a lot of cash in its hands to service its debts. Currently, the amortization powers amount to EUR 4.2 billion.
Furthermore, the company still holds investment ratings with a stable outlook:
- Standard & Poor’s: BBB;
- Moody’s: Baa3;
- Fitch: BBB-.
Outlook
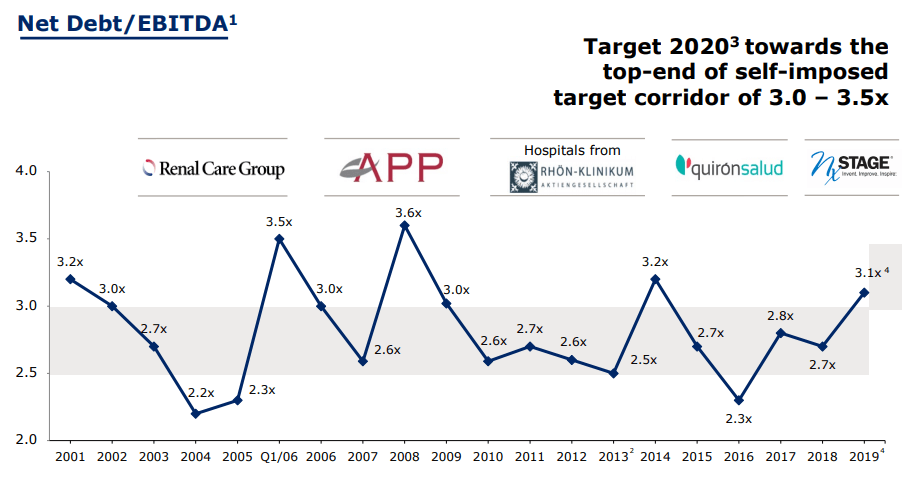
Now, post-COVID, Fresenius SE expects growth of 3 percent to 6 percent and net income growth of -4 percent to 1 percent by FY 2020. Net debt/EBITDA is expected to be around the top-end of the company’s self-imposed target corridor of 3.0x to 3.5x. The medium-term growth targets (2020-2023) are as follows (CAGRs):
- Organic sales growth: 4 percent to 7 percent
- Organic net income growth: 5 percent to 9 percent.
Thus, Fresenius will continue to grow. It also operates in the critical market for health services. Although the margins are low (see above), demand for its services and products is expected to continue in the future. Of course, the company is profiting here from its global positioning of a strong market position in many markets (for example, hospital services and dialysis). In this respect, the fundamental valuation for shareholders has not changed in recent years.
Nevertheless, the times when the company can shine with high growth figures seem to be over. Now comes the time of consolidation. Fresenius SE must now prove that it can expand its acquisitions into meaningful and organically growing units.
Besides, the company must address its debts. The company has already proven in the past that it can get out of debt quickly. Therefore, the management has experience with deleveraging, even if this is no guarantee that the company will succeed again so quickly.
Better than expected 3Q results
Fresenius also delivered better than expected third-quarter results. Fresenius achieved sales growth of 5 percent in constant currency. In the first nine months, sales growth was even 3 percent (5 percent in constant currency). In constant currency, EBIT even increased by 1 percent in the third quarter.
One of the very few real aristocrats in Europe
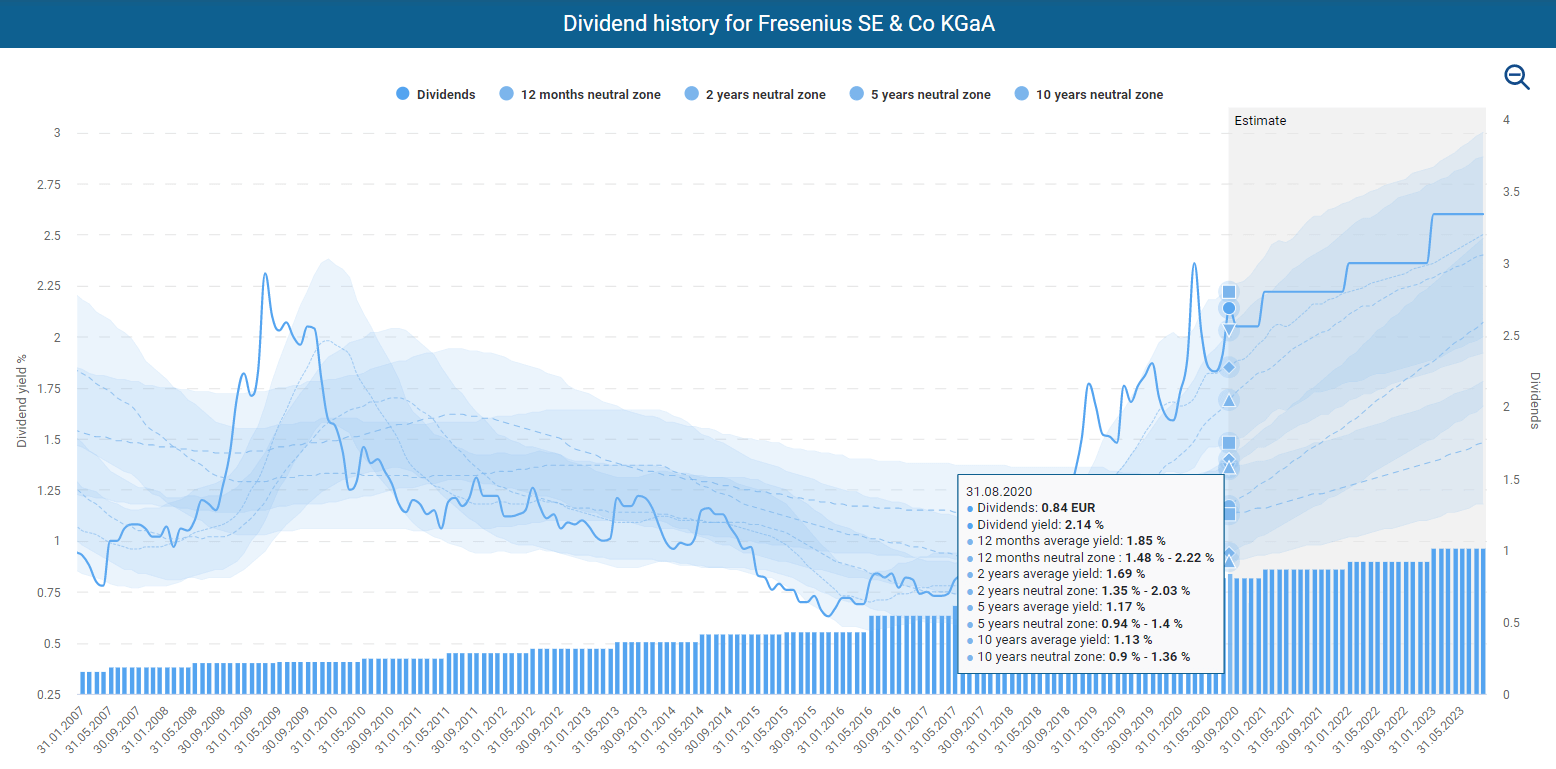
For dividend investors, however, Fresenius SE is attractive. It is one of the few dividend aristocrats from Europe and the only one from Germany. The company has increased its dividend every year for 28 years. The company has a very reasonable dividend policy, which I appreciate. Firstly, the company plans to align dividend growth to EPS growth.
Furthermore, Fresenius SE wants the payout ratio not to exceed 25 percent. While this is already relatively low, it shows a very conservative and defensive approach. The current dividend yield of 2.14 percent is historically high. Recently, however, the rates of increase have fallen sharply. The last increase was just 5 percent. In 2018, Fresenius SE had increased the dividend by 20 percent. I expect growth to remain in the single digits in the coming years.
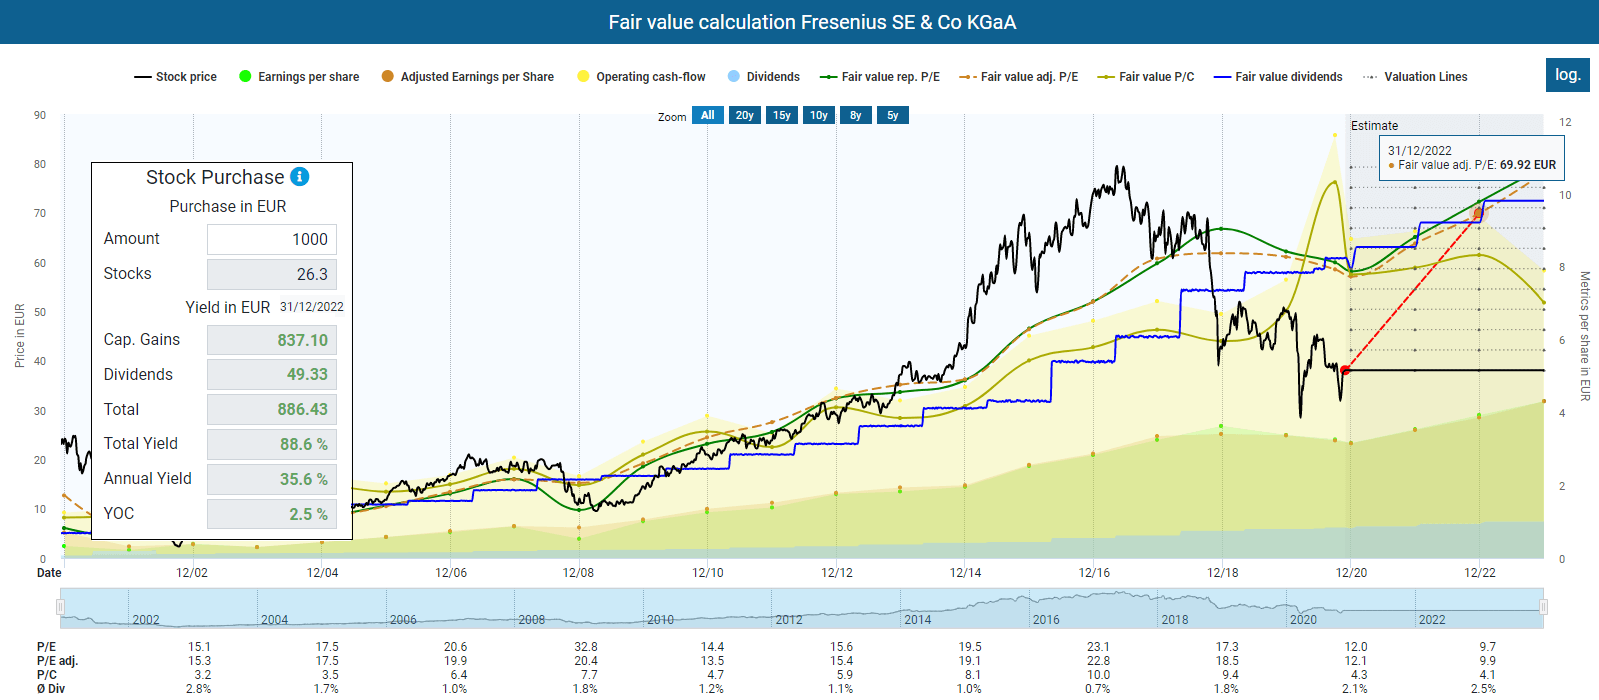
Still undervalued
The share price weakness has resulted in Fresenius being fundamentally cheaper than it has been for a long time. Even during the financial crisis, Fresenius SE had a higher adjusted P/E ratio than now. The overvaluation leads to an impressive upside potential of 70 percent by the end of next year, based on the adjusted P/E ratio. Of course, such considerations are just arithmetical shenanigans, but they illustrate the massive discount that the market has already priced in for Fresenius SE.
I bought my first stake in Fresenius in August. At that time, the valuation was as follows:
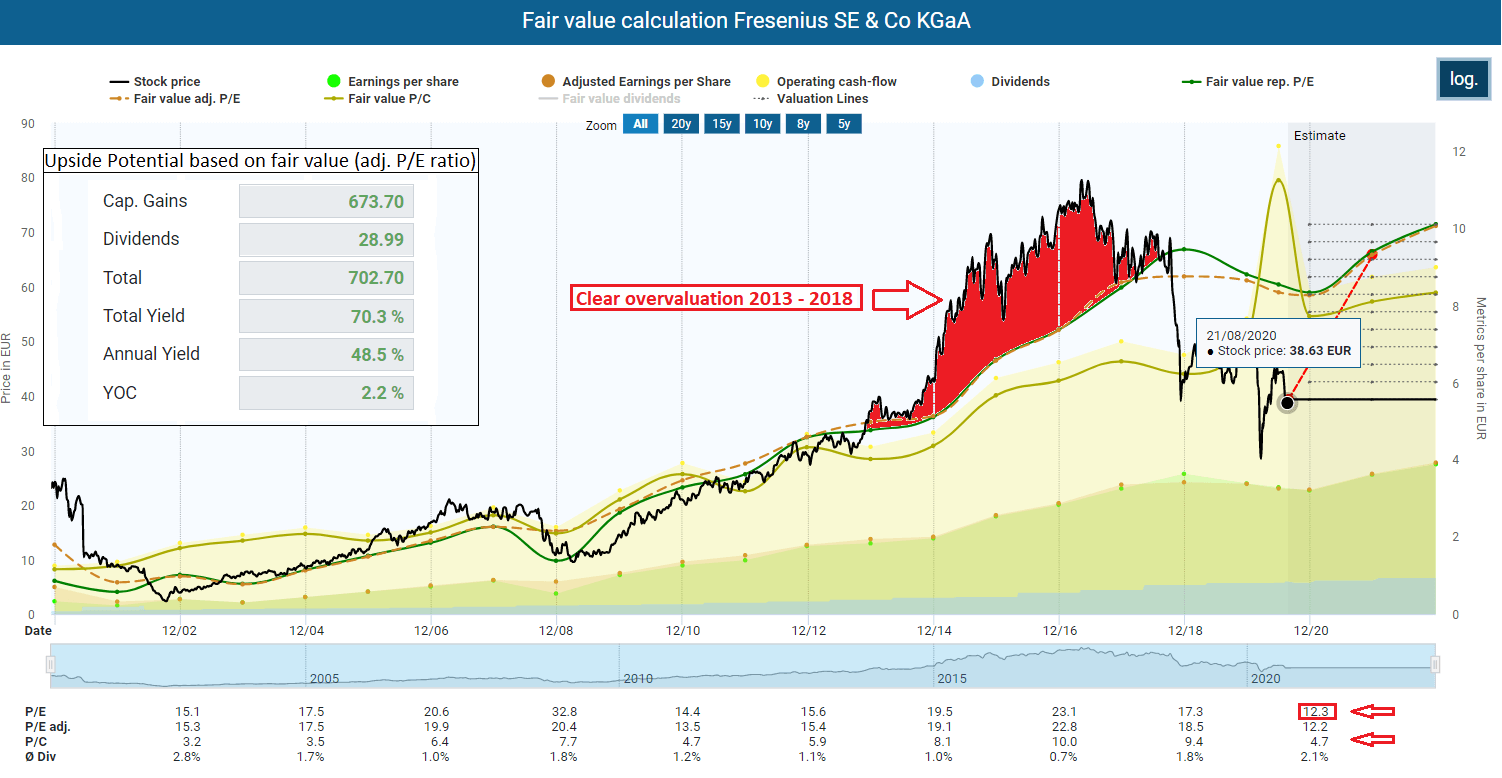
In November, the situation hardly improved. Interestingly, however, after the low in March at EUR 28, Fresenius formed a higher low at the end of October at EUR 31, which could signal that the price has turned around. To do so, it would now have to form even higher highs, i.e., rise above EUR 44 for the time being. Who knows. These are exciting considerations, but they were not decisive for my buying decision.
Conclusion
As I wrote above, the company is now in a consolidation phase, which could be a good opportunity for long-term investors to put shares into their portfolios.
In my opinion, TeamViewer is one of those tech companies with an enormous global potential that many investors do not yet have on their screens. I started to buy the first shares during the Corona Crash and in August as well. The company belongs to my handful of pure growth stocks that do not pay a dividend. You can find a more detailed description in my TEV Dividend Diary August report.
There is still upside potential
Based on the fundamental multiples, TeamViewer looks quite expensive. But the company is growing like crazy so that there is still stable upside potential for the next years. Based on the expected operating cash flow, there is an upside potential of almost 140 percent by the end of 2023.
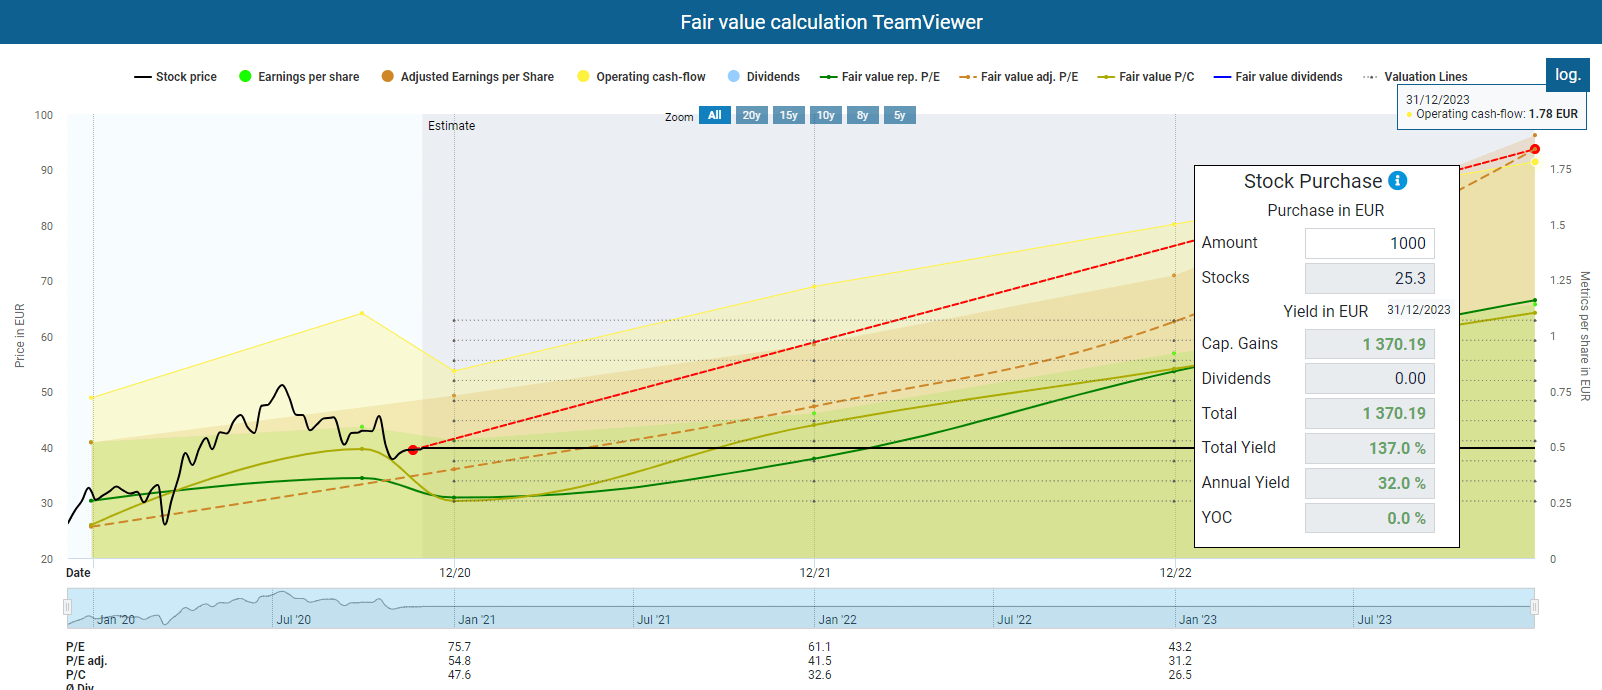
What I find so impressive is that the company is already highly profitable despite its young age.
Latest quarterly results
These are TeamViewer’s latest quarterly results:
- Q3 billings up 29 percent YoY (+34 percent cc) to EUR 106.4 million and 9 million billings of EUR 332.1 million (+48 percent YoY; +50 percent cc)
- Q3 adjusted EBITDA of EUR 58.2 million (+26 percent YoY; +34 percent cc) and 9 million adjusted EBITDA of EUR 189.3 million (+58 percent YoY; +61 percent cc)
- Q3 first quarter in a normalized market environment after COVID-19 pandemic-related extra demand
- The number of subscribers increased to 567 thousand as of 30 September 2020
- TeamViewer has been installed on more than 2.5 billion devices
- Ubimax integration is progressing well. In July 2020, TeamViewer announced the acquisition of Ubimax. Ubimax provides an AR-based one-stop-shop to its customers. Its portfolio includes the industrial AR software platform Frontline, wearable computing devices, and consultancy services. With Ubimax, the Total Addressable Market (TAM) size increases by EUR 10 billion to EUR 40 billion in 2023. The combination of the product portfolios also accelerates the TAM’s annual growth rate from 24 percent to 27 percent, mainly driven by the Augmented Reality market’s substantial expansion.
- Billings guidance for 2020 increased to EUR 450-455 million, excluding Ubimax contribution.
So the company is on track, and the Corona pandemic has given a further boost. The market may drop the company again, as the pandemic might slowly end after the winter. However, I don’t see the long-term prospects of success as being limited. I will, therefore, take advantage of further price weaknesses to make additional purchases.
Novo Nordisk is a world leader in healthcare, founded in 1923 and headquartered in Denmark. The company’s goal is to defeat diabetes and other serious chronic diseases such as obesity and rare blood and metabolic disorders. As the world market leader, the company will benefit from global demographic developments. The increasing prosperity in Asian and hopefully also African countries will increase the cases of all the unpleasant side effects obesity and diabetes. I previously had a smaller position in Novo Nordisk, which I have now increased. I’m a bit annoyed that I haven’t made significant gains in the last few years, but that’s the way it is. Measured by the expected adjusted profits, there is still an upside potential of more than 25 percent for the end of 2023.

Vonovia is a German real estate group. The company owns over 400,000 apartments in Germany, Sweden, and Austria. It has been in my portfolio for several years. However, I have never bought additional shares. That has now changed. I have thus adjusted my share in Vonovia to the fact that my total portfolio has also grown. After my new purchase, Vonovia shares now account for 1.5 percent of my full portfolio, an area I can live with. Even though growth in Germany as Vonovia’s key market is limited, Vonovia is expanding strongly into other European countries. Therefore, the growth is mostly external, but for me, that is okay because the rental income is relatively predictable. Also, the Corona pandemic has proven that the business model is somewhat crisis-proof.
There is even some upside potential if we consider the fair value for the end of 2022. But I do not expect a too strong return from Vonovia. It is a company with which I intend to profit from the real estate boom.

The Amundi Index MSCI Emerging Markets UCITS ETF DR (D) is my second ETF. My other ETF tracks the MSCI USA Financials Index (I wrote about it here). You can find a more detailed description of the Amundi Emerging Markets ETF here.
Watchlist for December
Next month, there will be some additional purchases of shares. I am relatively flexible here. Either I buy new positions, or I increase my shares in existing investments.
The following companies are on my watchlist in particular:
- Microsoft (MSFT)
- Merck & Companies (MRK)
- Intel (INTC)
- Salesforce (CRM)
- Mayr-Melnhof Karton AG
- Bayer
- Sysco (SYY)
- AT&T (T)
If you look at my report from last month, you will see that none of the companies I bought were on my watchlist. Why is that? Is the watchlist nonsense, and in the end, I only do what I want anyway? Yeah, a little bit. I don’t have a fixed system for my stock purchases, and that’s one thing I have to consider changing.
However, I have an extensive overview of many companies that I look at from time to time. The watchlist companies are mostly companies that I have currently examined particularly carefully, where substantial changes are imminent or which are in my focus for other reasons.
They are present to me in some form, which is why I put them on the list and perhaps monitor them a little more closely than other companies. But it often happens that I invest in other companies, after all. And so it happens that I buy other companies because it seems convenient at that moment.
Have you received dividends this month? What’s on your watchlist? Let me know and write it in the comments.
Did you like the article? Stay tuned for the following content… It is all entirely for free! Enjoy!
If you don’t want to miss any new articles, you can easily follow me on
or Twitter.
Sharing Is Caring
Your thoughts are too valuable to keep them to yourself. Make them available to the world and the community by sharing them with us. All you have to do is leave a comment after reading the posts on the blog. Just use clear writing and clear thoughts.

I like your analysis! Very though. An aspect I forgot to consider for a long time, is the taxation. Based in Austria, I have to file a reimbursement letter to the german tax office to get some of my dividend tax back. In France you can forget it, also Italy. Buying shares in Britain, US, or in Austria I pay the 27,5% tax on dividend only. Taxes are very difficult if you buy US MLPs like sunoco, Energy Transfer. So keep an eye on taxation if you are eager for dividends!
Thanks for coming by Bertram.
Taxes are really an issue. I’m kind of annoyed that the EU doesn’t manage to enforce a uniform approach here. The fact that you have to reclaim the withholding tax personally within the EU as an EU citizen really hurts.
Indeed, U.S. MLPs are not as attractive because of taxation. I don’t think that will change in the next few years.
Best,
TEV
I am learning about stock market and started investing in small sums. I hve to say that your blog is “pure gold” for me. Such a generous material. Please remember that especially when gold orices go up.
Keep rhe great work (in our help).
Thanks a lot
Hi Bassem,
thank you so much for coming by and for your kind words. Happy that you found some value here.
Best,
TEV