
As you know, I regularly publish stock analyses on other platforms. The good thing about the TEV blog is that I can try out new formats here. Therefore I would like to present a “Fundamental Stock Pick” at regular intervals in the future and create a short analysis of the stock for my readers. The purpose of this format is to give readers a quick overview of the company’s key figures. The stock pick this week is Procter & Gamble. In this analysis, you will find the following aspects:
If you want such a “Fundamental Quick Stock Price” analysis of a specific company, just write in the comments which company you want me to analyze.
–> Click here for last week’s Fundamental Stock Of The Week. <–
–> Click here if you want to see all Fundamental Stock Picks Of The Week. <–
The company
Let us first take a look at the company and its business model. Procter & Gamble is a consumer goods manufacturer and is, therefore, one of the defensive companies that are generally less susceptible to crises. Procter & Gamble offers products for everyday use and personal care. The portfolio includes many well-known brands:
In the past, Procter & Gamble has sold many brands to focus on the more profitable ones. In 2015 and 2016, for example, the company sold a large package of more than 40 brands to Coty. I will show you later that this focus has been very worthwhile.
Business development
How has the company developed in terms of business? Has it grown or shrunk? Does it generate stable cash flow? In this paragraph, we look at the operational growth of the company. Although past growth is no guarantee that a company will continue to grow in the future, it does give a good picture of the general condition and health of a company. This picture allows a better evaluation of the following test parameters because we have to evaluate young and fastly growing companies differently than established blue chips that already have an established market position and therefore do not grow that strong.
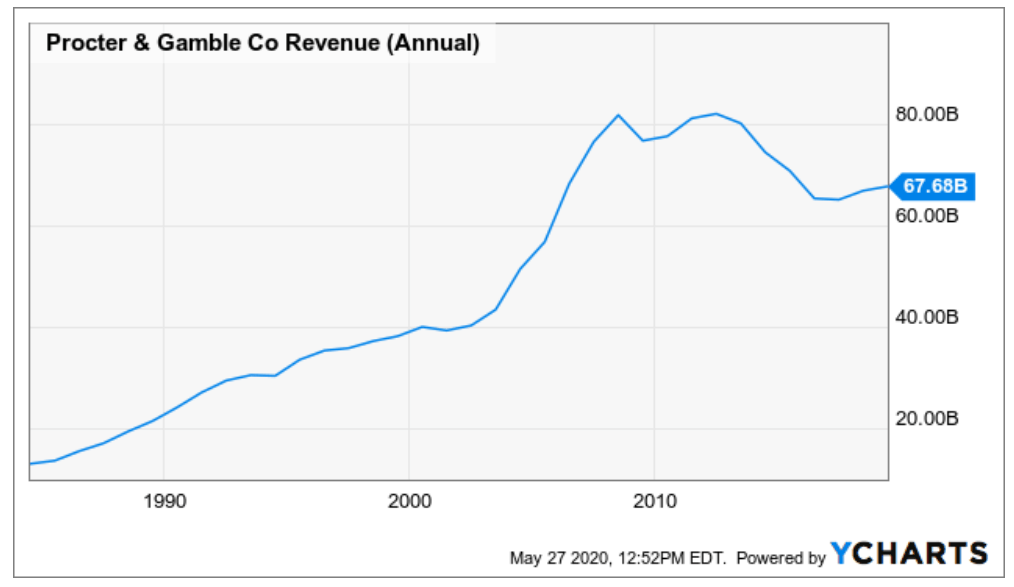
You can see here that Procter & Gamble is a true sales giant but has had to struggle with stagnating and declining sales since 2008/2009. These issues were the main reasons why the management started to focus on the core brands. The sale of unprofitable brands has naturally also hurt sales growth. Nevertheless, Procter & Gamble has recently managed to return to a growth path.
Profitability
Companies should not only grow but also be profitable. Profitability ultimately indicates how much of the turnover remains when all other costs such as taxes, depreciation, etc. are deducted. The difference between revenue and profit is the margin. Companies should have the highest possible margin (i.e., as much profit as possible should remain from revenue).
Margins at Procter & Gamble are relatively stable, which is a good sign of a defensive and sustainable business model. The gross margin has even risen again somewhat, after having fallen slightly in recent years. I think the margin is satisfactory overall for investors.
Don’t worry too much about the dip in the net margin here. The net margin ultimately indicates how much profit remains from sales after a company has made all expenses (including dividends, share buybacks, etc.). In recent years, Procter & Gamble has made extreme use of share buybacks and thus automatically reduced the net margin.

Procter & Gamble Fundamental Stock Analysis – The value check
Warren Buffett once said: “Price is what you pay; value is what you get”. The idea is quite simple but relatively difficult to realize. Investors like Warren Buffett consider whether the price of a share is lower (or higher) than its value. Imagine a car that someone sells for a price x. Imagine that the motor alone is worth more than the selling price. The intrinsic value is, therefore, higher than the amount paid. So if you buy the car at this price and the radio or some tires break down, it doesn’t matter, because you got all these things almost “for free”. That gives you a fair amount of protection, doesn’t it? That’s what investors, such as Warren Buffett, call a margin of safety. Quite an easy thing, right?
However, putting this theory into practice is not always easy. There are many different methods to find out such a margin of safety. So let’s see if we can determine such a “Margin of Safety” for today’s “Fundamental Stock Pick Of The Week”.
Procter & Gamble Fundamental Stock Analysis – Dividend Check
Dividends can indicate a company’s intrinsic value. Dividends are payments made by a company to its shareholders. Every shareholder who holds shares in the company on the ex-dividend date is entitled to receive dividends (click here for TEV’s dividend calendar). The dividend yield is the ratio of the dividend payment per share to the share price. If a share costs $100, and the company pays $2 in dividends per share, the dividend yield is 2 percent.
But you must also be careful when considering dividend yields in isolation. An unusually high dividend yield (especially anything above 7 or 8 percent) is a big red warning sign. The market gives you no presents, and with a high chance always comes high risk. Maybe, the cash flow or the profit does not cover future payouts, so that the company has to reduce or even cancel the payouts. Therefore, we have to consider other variables, such as the payout ratio.
The payout ratio shows you what percentage of profit the company would have to spend to finance the dividend payout. Anything over 100 percent is, of course, not good, because the company then cannot save for bad times or finance further growth. In such constellations, investors must be particularly careful.
Procter & Gamble is a dividend aristocrat that has increased its dividend every year for 63 years. If you had bought Procter & Gamble shares 20 years ago, you would now have a yield on cost of almost 10 percent. Imagine getting 10 percent of your original investment amount in cash every year for the rest of your life!
The dividend scoreboard is as follows. With a current dividend yield of 2.8 percent, the dividend yield is somewhat below average. On the other hand, the annual increases have recently risen again slightly and are now back above 4 percent.
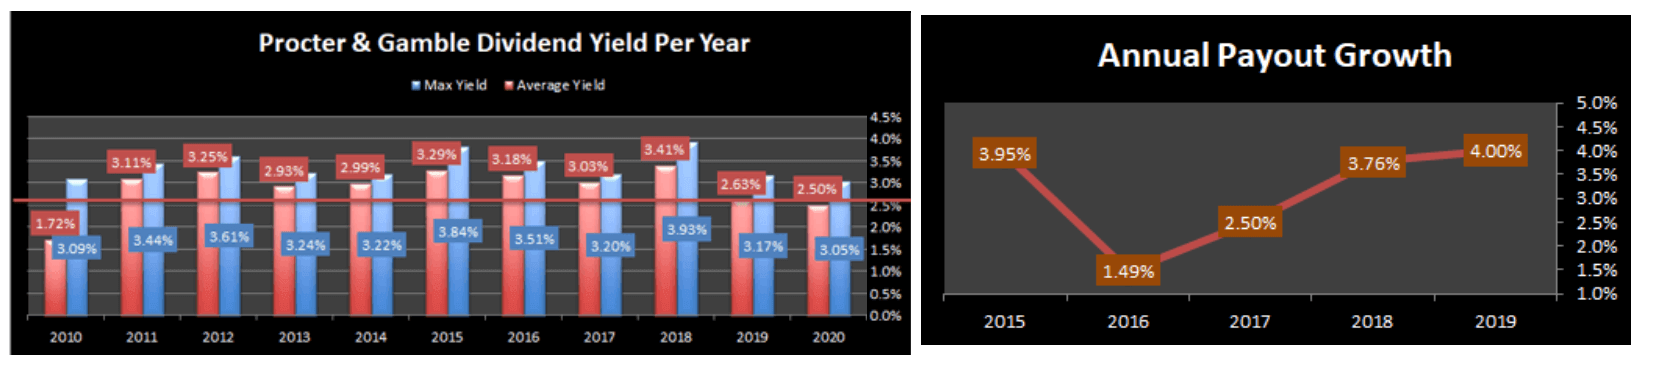
I, therefore, believe Procter & Gamble is a good company for new investors to build up initial cash flow with dividends. However, it will take time for this cash flow to become a torrent.
Price / Book Value
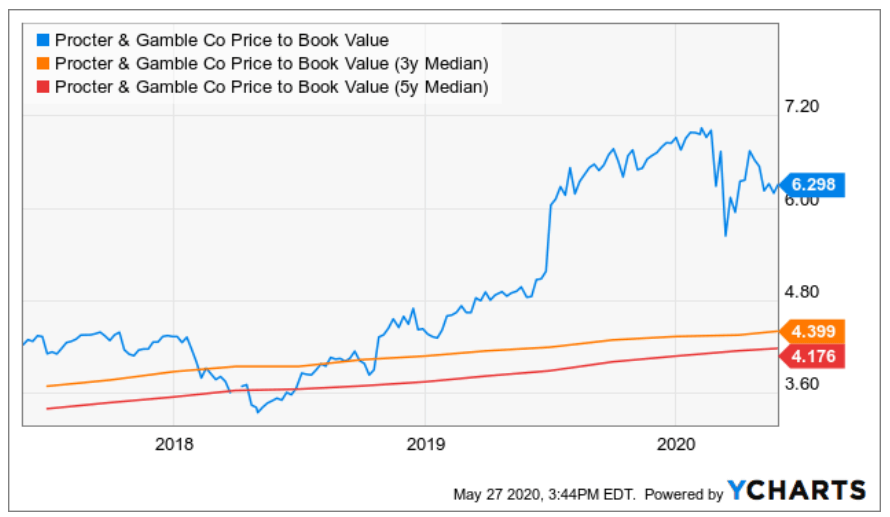
The Price / Book Value ratio compares a company’s current market price to its book value. A value of 1 means that the price of a share corresponds precisely to the (proportionate) book value of the company. Accordingly, a ratio below 1 is a good sign for value investors. However, such gems are rather rare to find, and if so, it is worth taking a closer look as well. For example, companies that operate in a challenging market with poor prospects (e.g., tobacco or oil) can have a particularly low price/book value. But at Procter & Gamble, we see an extremely high Price/Book Value ratio. With over 6, the ratio is already extremely high in itself. But it is also almost 50 percent too high in historical comparison. That indicates a strong overvaluation.
Price / Cash Flow
The Price/Cash Flow ratio compares a company’s current market price to its cash flow. With this metric, you can check how many years it would take a company to buy itself with its yearly cash flow. That the ratio is within its historical range is also because Procter & Gamble has been able to increase its cash flow in recent years. However, this is mainly because financing activities have decreased. In operational terms, cash flow growth was more or less flat.

Balance Sheet
The balance sheet says a lot about the financial health of a company. Is it heavily indebted, or is the company liquid enough to pay its debts? A useful metric is the debt/asset ratio that shows you the percentage of a company’s assets that are provided via debt and liabilities. At Procter & Gamble, we can see that the company has an extremely stable balance sheet. A debt ratio in the low 30 percent range is extremely solid. Procter & Gamble is, therefore, highly creditworthy. This healthy balance sheet makes it easier for the company to raise money on the capital market in the event of bigger takeovers or to remain liquid in times of crisis.

Procter & Gamble Fundamental Stock Analysis – Fair Value Calculation
The Price / Earnings ratio (P/E ratio) tells investors the ratio of a company’s share price to the company’s earnings per share. This figure shows you how many years you will have to wait until you have recovered your purchase price per share with the earnings per share. So if a company has a P/E ratio of 10, it would take ten years for your profits to be as high as the price you paid for your investment. One can also say that it would take ten years before the company could buy itself with the profit. Accordingly, one can first make a general statement: The lower the P/E ratio, the cheaper the stock appears.
You should know some potential pitfalls here. This calculation assumes stable earnings for the future. However, profits may drop in the future. Likewise, earnings can be “whitewashed” through accounting measures. It is, therefore, essential to conduct a thorough analysis and not just rely on the current P/E ratio!
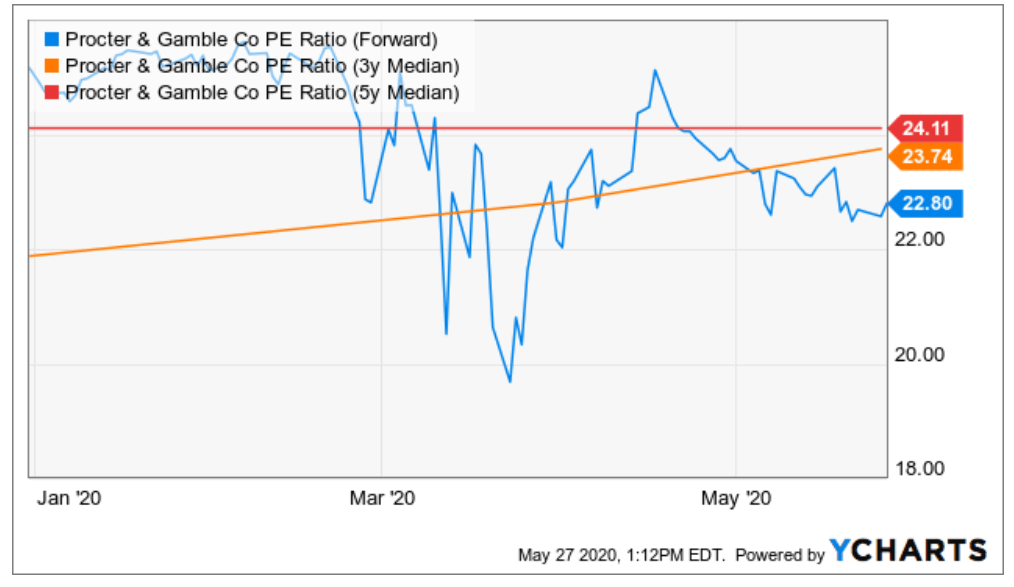
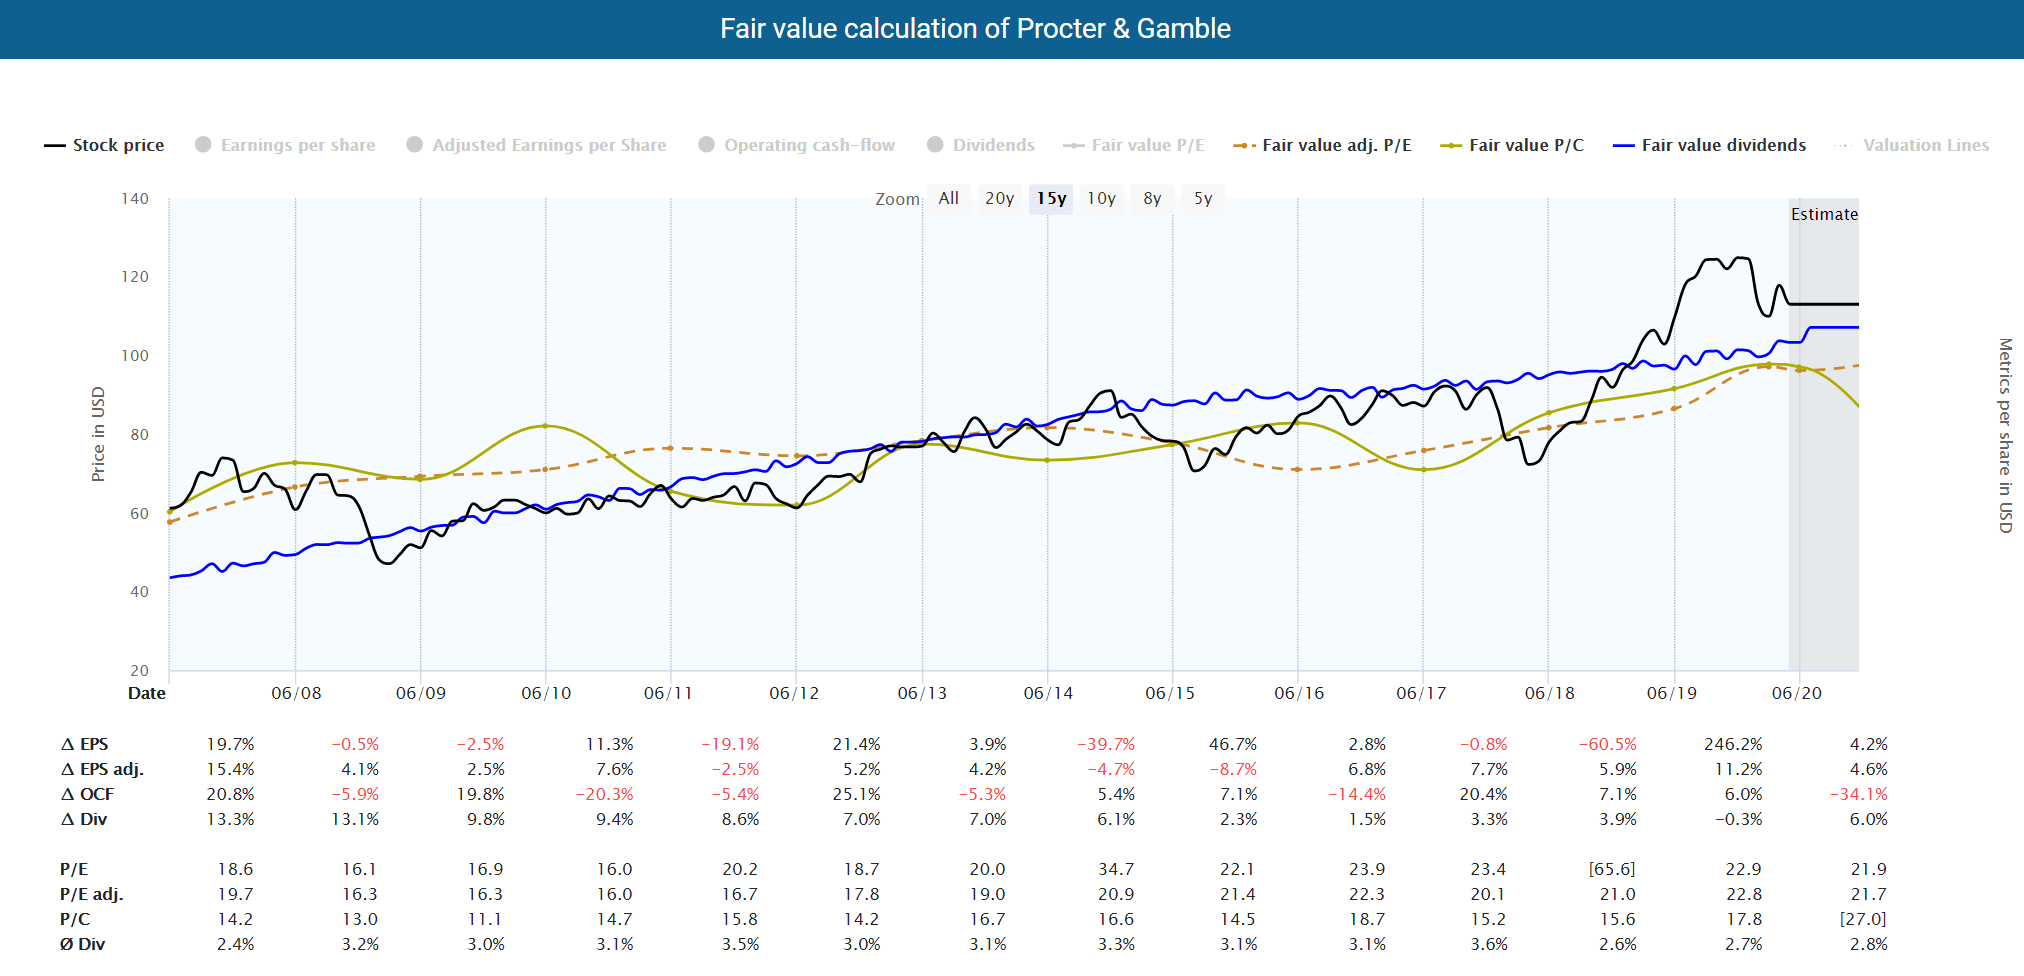
You can see here that Procter & Gamble is slightly undervalued with a price of about $113 when you compare the current valuation with the historical median of the last three and the last five years. At prices above $120, I would classify the company as overvalued. In this respect, the upside potential based on the historical P/E ratio is limited.
The picture changes if we look at the fair value and use the adjusted profit as a basis. This metric shows us that Procter & Gamble is massively overvalued right now. Based on adjusted earnings, the share was last undervalued in 2018.
In companies that are so overvalued, I only invest in small tranches to take advantage of the cost average effect. This way, I don’t miss out on further advancement, but in case of a setback, I can still buy additional shares without having to invest too much money in one company.
What are Procter & Gamble’s competitors?
Of course, you should never look at a company in isolation, no matter how much you go into detail. In the second step at the latest, you must compare the company with its competitors (peer group). Procter & Gamble’s competitors are in particular:
Newell Brands,
Colgate-Palmolive,
Clorox,
Kimberly-Clark,
Henkel,
Reckitt Benckiser,
Unilever,
Johnson & Johnson
Procter & Gamble Fundamental Stock Analysis – The Rating
TEV’s rating system
After every analysis of a company, I will use a three-grade rating. Its purpose is to ensure that readers recognize at first glance whether a company might or might not be worth investing in. The three steps rating at a glance.
Buy the jewel now rather than tomorrow if:
- There are no downsides, and the company has growth potential.*
- The upsides outweigh the downsides, and the company has enormous growth potential.
Worth an investment (maybe later after a second look) if:
- The upsides outweigh the downsides.
- The upsides are equal to downsides, but the company has growth potential.
No thanks if:
- No growth potential in the long term.
- The downsides outweigh the upsides.
*Of course, the growth potential is a part of the upsides, but it is also crucial in my final considerations.
Procter & Gamble Fundamental Stock Analysis – Conclusion
All in all, we can say the following about our stock pick today: Procter & Gamble is a company that has recently returned to stable growth again. It also has one of the best balance sheets you can currently find in the consumer goods sector. However, the company is presently massively overvalued. I would only consider an investment in tranches. That said, the company is definitely worth an investment, but there is no rush.
If you are looking for other stock investment in less cyclical companies, I definitely suggest the following defensive companies:

–> Click here for last week’s Fundamental Stock Of The Week. <–
–> Click here if you want to see all Fundamental Stock Picks Of The Week. <–
Did you like the article? Stay tuned for the following content… It is all entirely for free! Enjoy!
If you don’t want to miss any new articles, you can easily follow me on
or Twitter.
Sharing Is Caring
Your thoughts are too valuable to keep them to yourself. Make them available to the world and the community by sharing them with us. All you have to do is leave a comment after reading the posts on the blog. Just use clear writing and clear thoughts. You can also share this post with your favorite network:


